Styling Neo4j Server Visualisation
To give you a head start when using Neo4j-Browser I wanted to share these quick tips for styling and querying.
First of all, you have to download, unzip and start neo4j. If you have a JDK (Java7) installed and on the path it should look like this:
$ cd neo4j-community-2.1.1
$ bin/neo4j start

Using additional JVM arguments:  ....
Starting Neo4j Server...WARNING: not changing user
process [70299]... waiting for server to be ready...... OK.
http://localhost:7474/ is ready.
As told, we open the URL http://localhost:7474/ in our browser and can start working with Neo4j and its query language Cypher directly.
If you want to learn more first, click on any of the helpful links show after startup, these are quick slide shows that introduce the different concepts quickly.
-
Intro - a guided tour
:play intro -
Concepts - GraphDB 101
:play concepts -
Cypher - query language
:play cypher -
The Movie Graph - a mini graph app
:play movie graph
But we want to get going with the visualization. So let’s import some data, query it and start styling. To do that, we run :play movies, click on the huge Cypher CREATE … statement and
run it using the triangular run button in the command line editor.
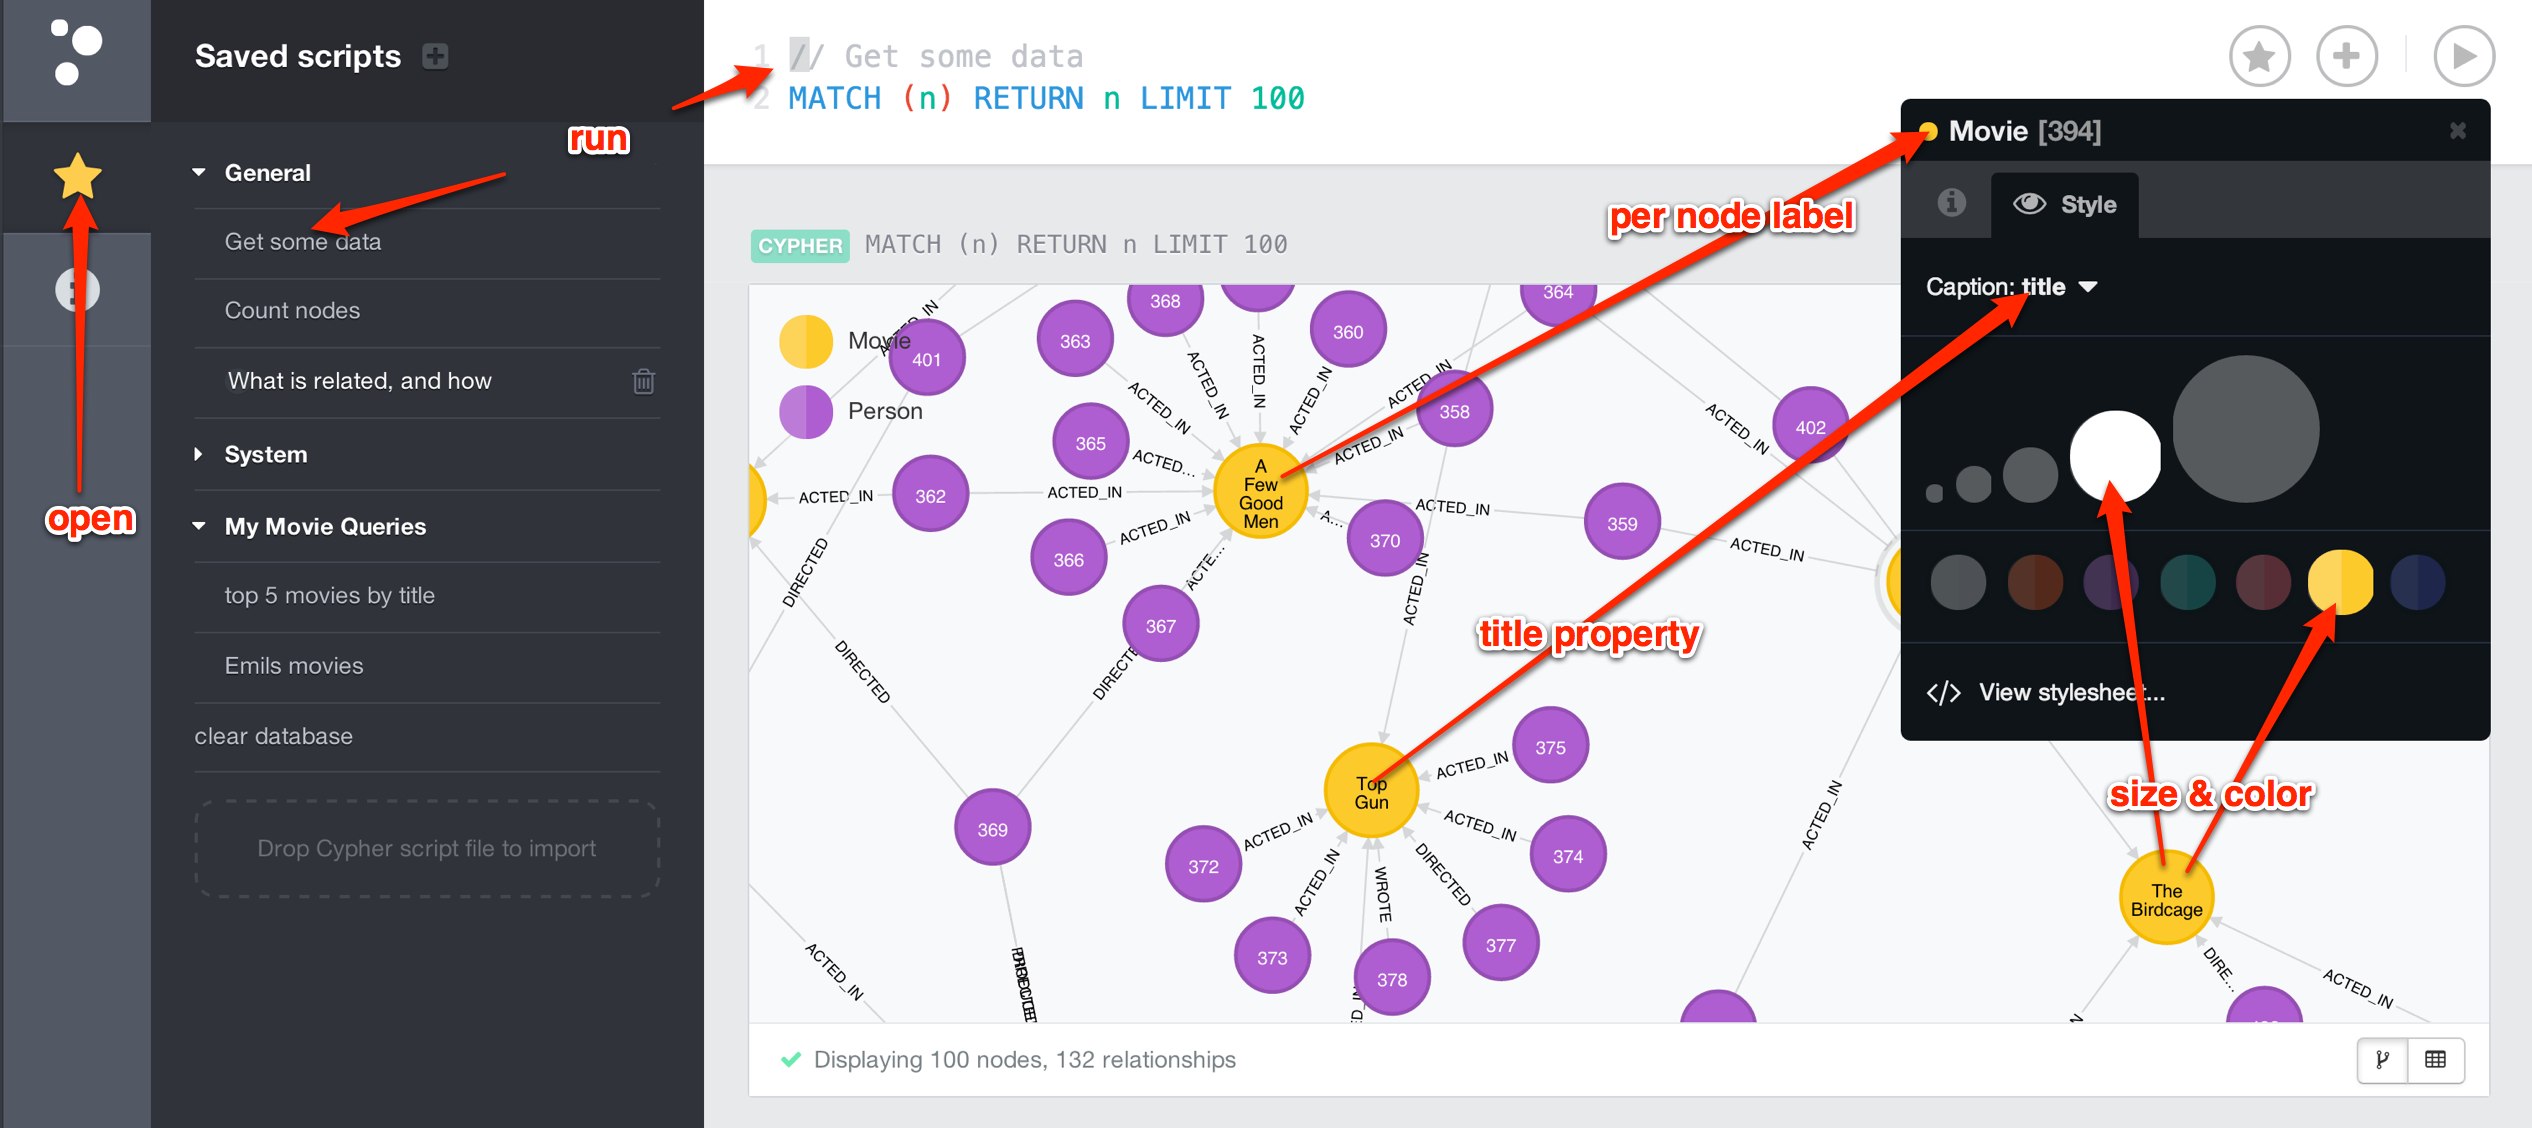
After a few seconds the data is imported, but we’ll see only the lonely Matrix node that’s returned. We want to see more and that’s why go to the favorites tab on the left, indicated by a star and click on the Get Some Data entry, preferably on the green round run-button besides the title. This should give us a graph visualization to play with.
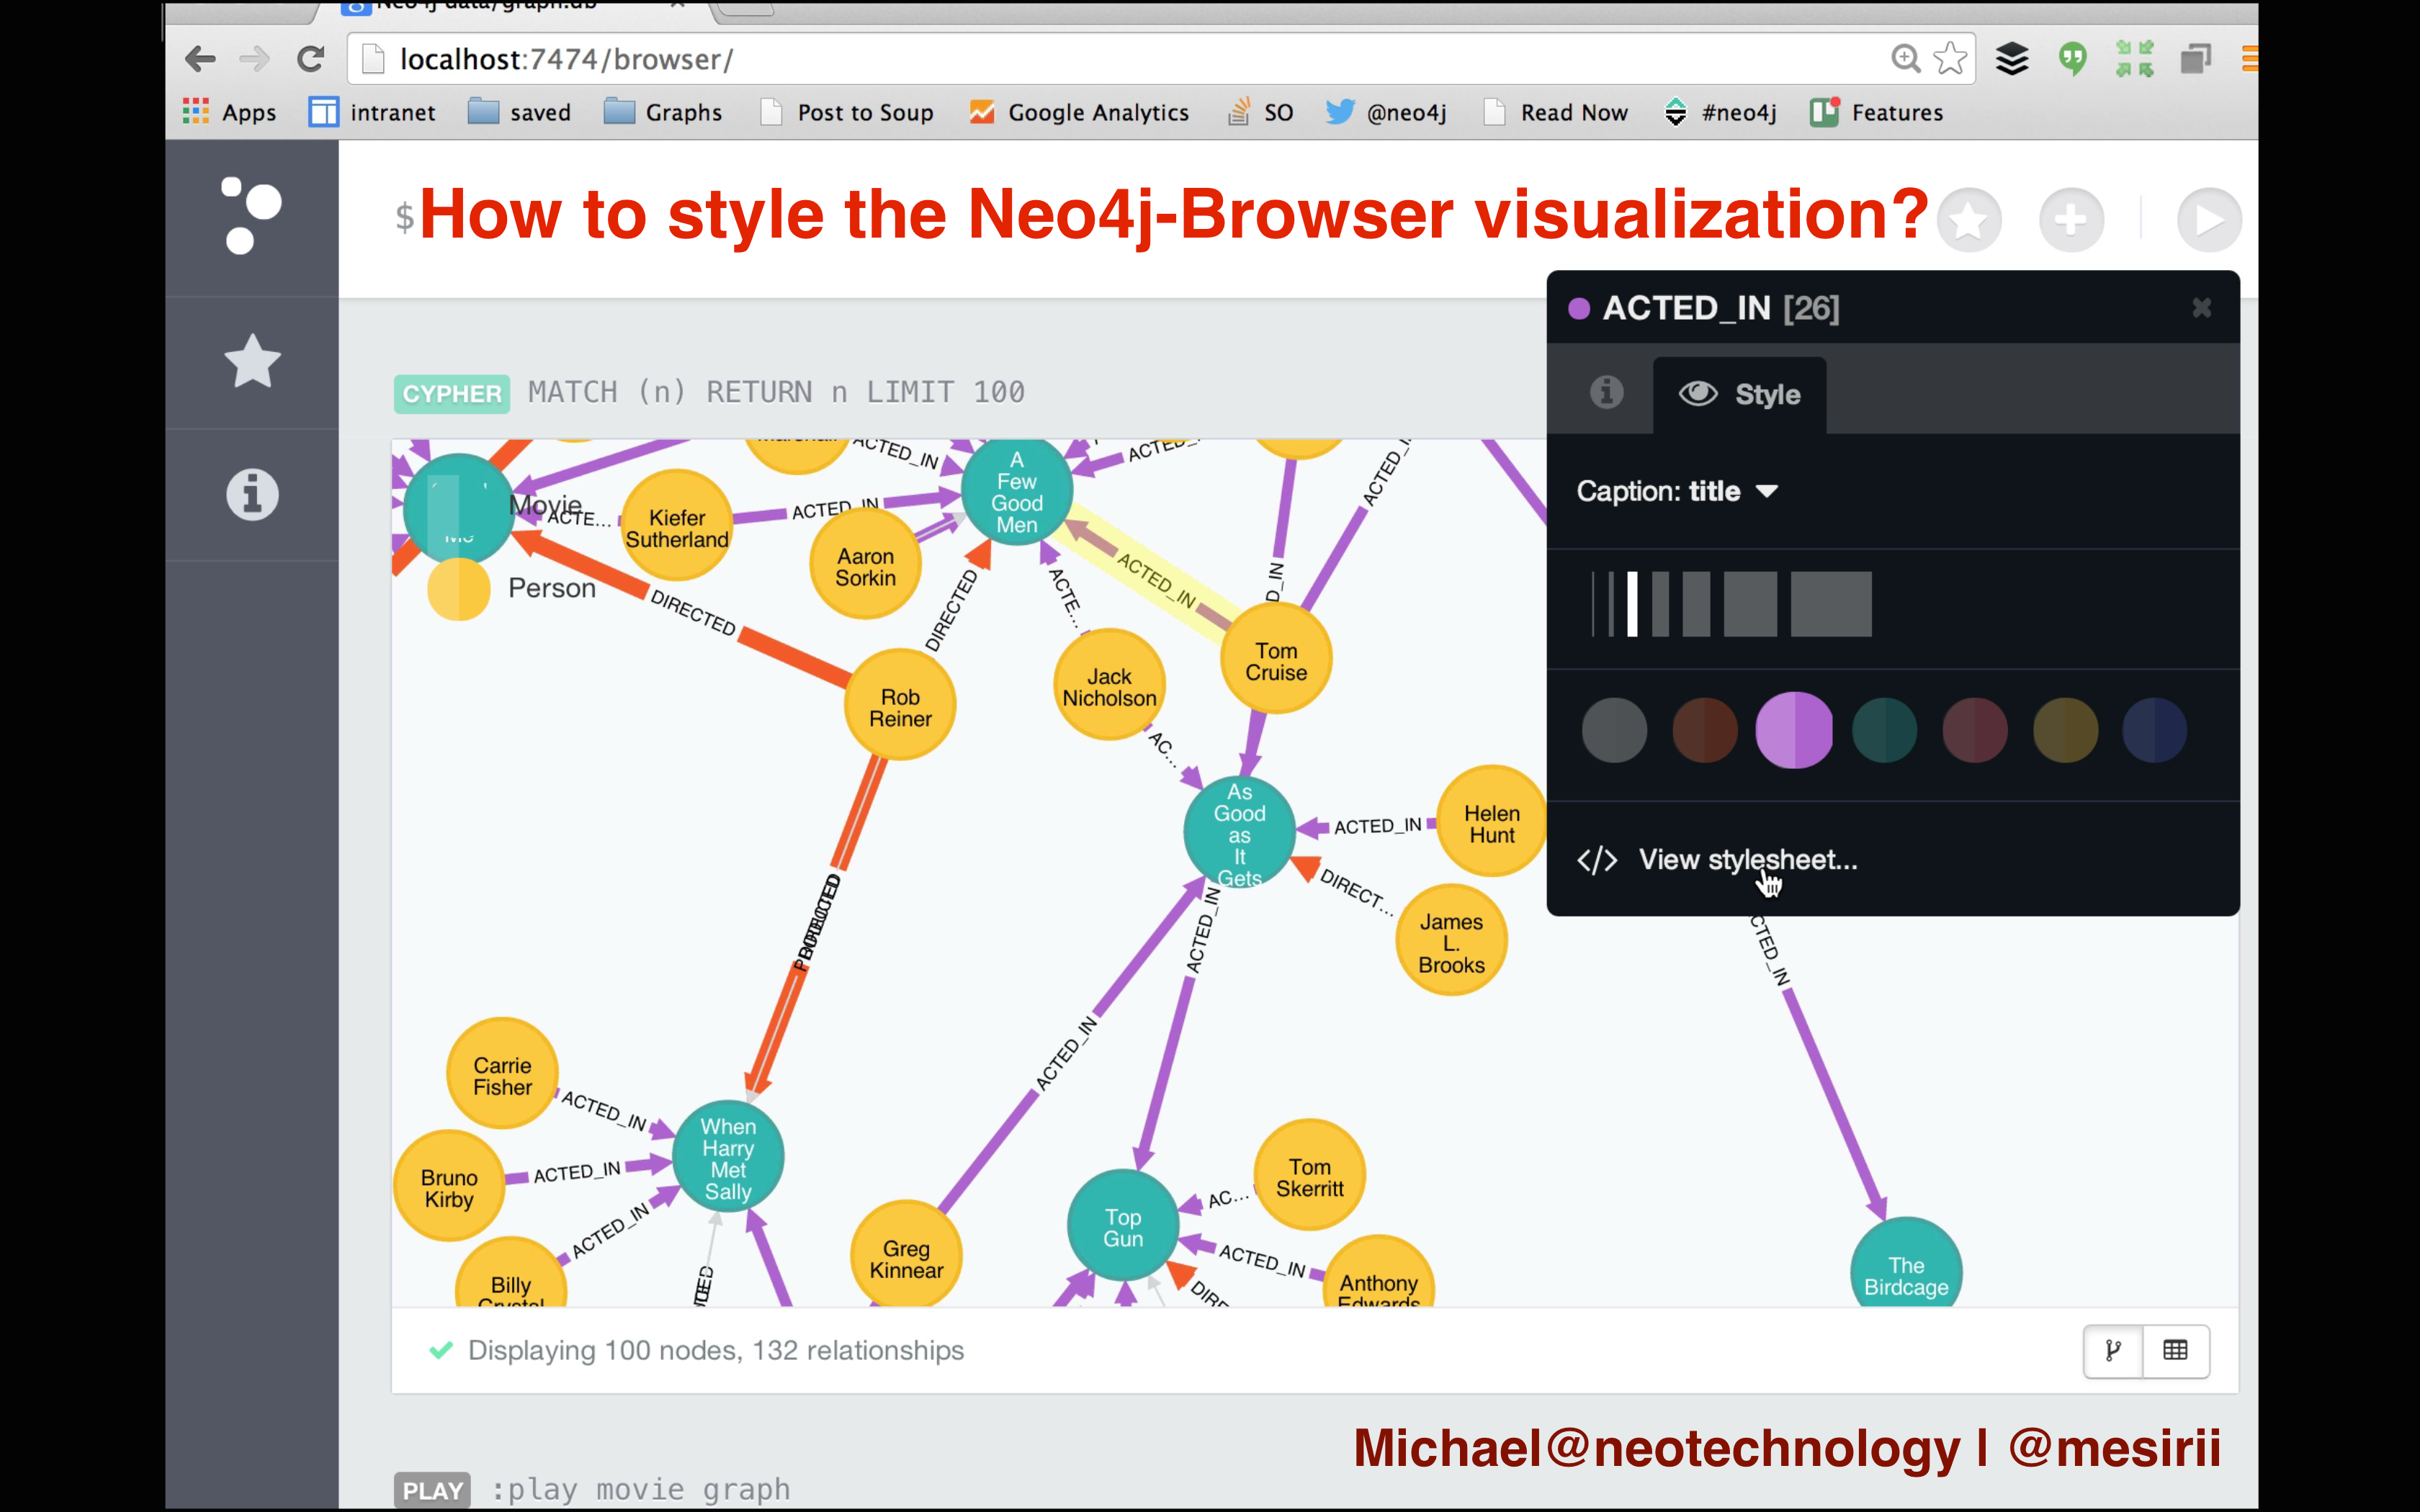
But those nodes only show numbers! Now click on any red node that has ACTED_IN relationships pointing to it. These are Movie nodes. In the popup you’ll see the node label "Movie" on the top.
In the tab on the right, denoted with an "eye", you can set the styling parameters and property chosen for the displayed title.
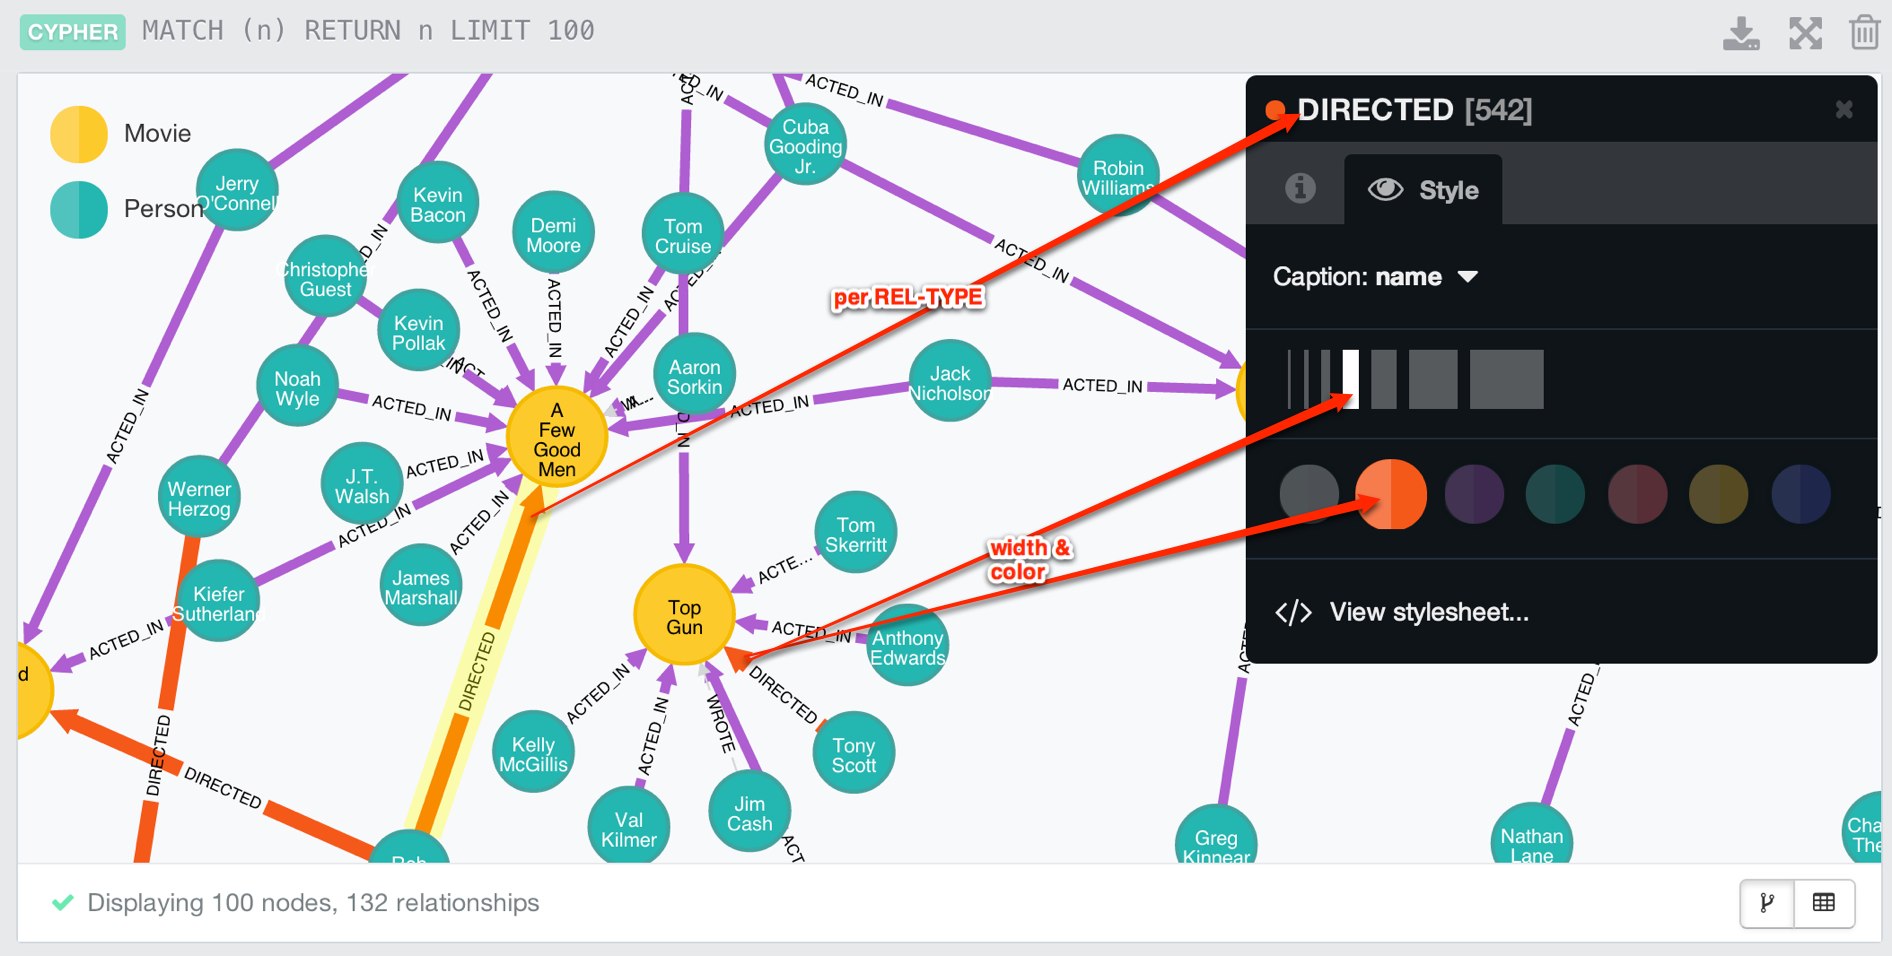
Play a bit with the styling options and do the same for the other nodes (labeled Person). The next step is styling relationships, just click on one (e.g. DIRECTED) and try it out.
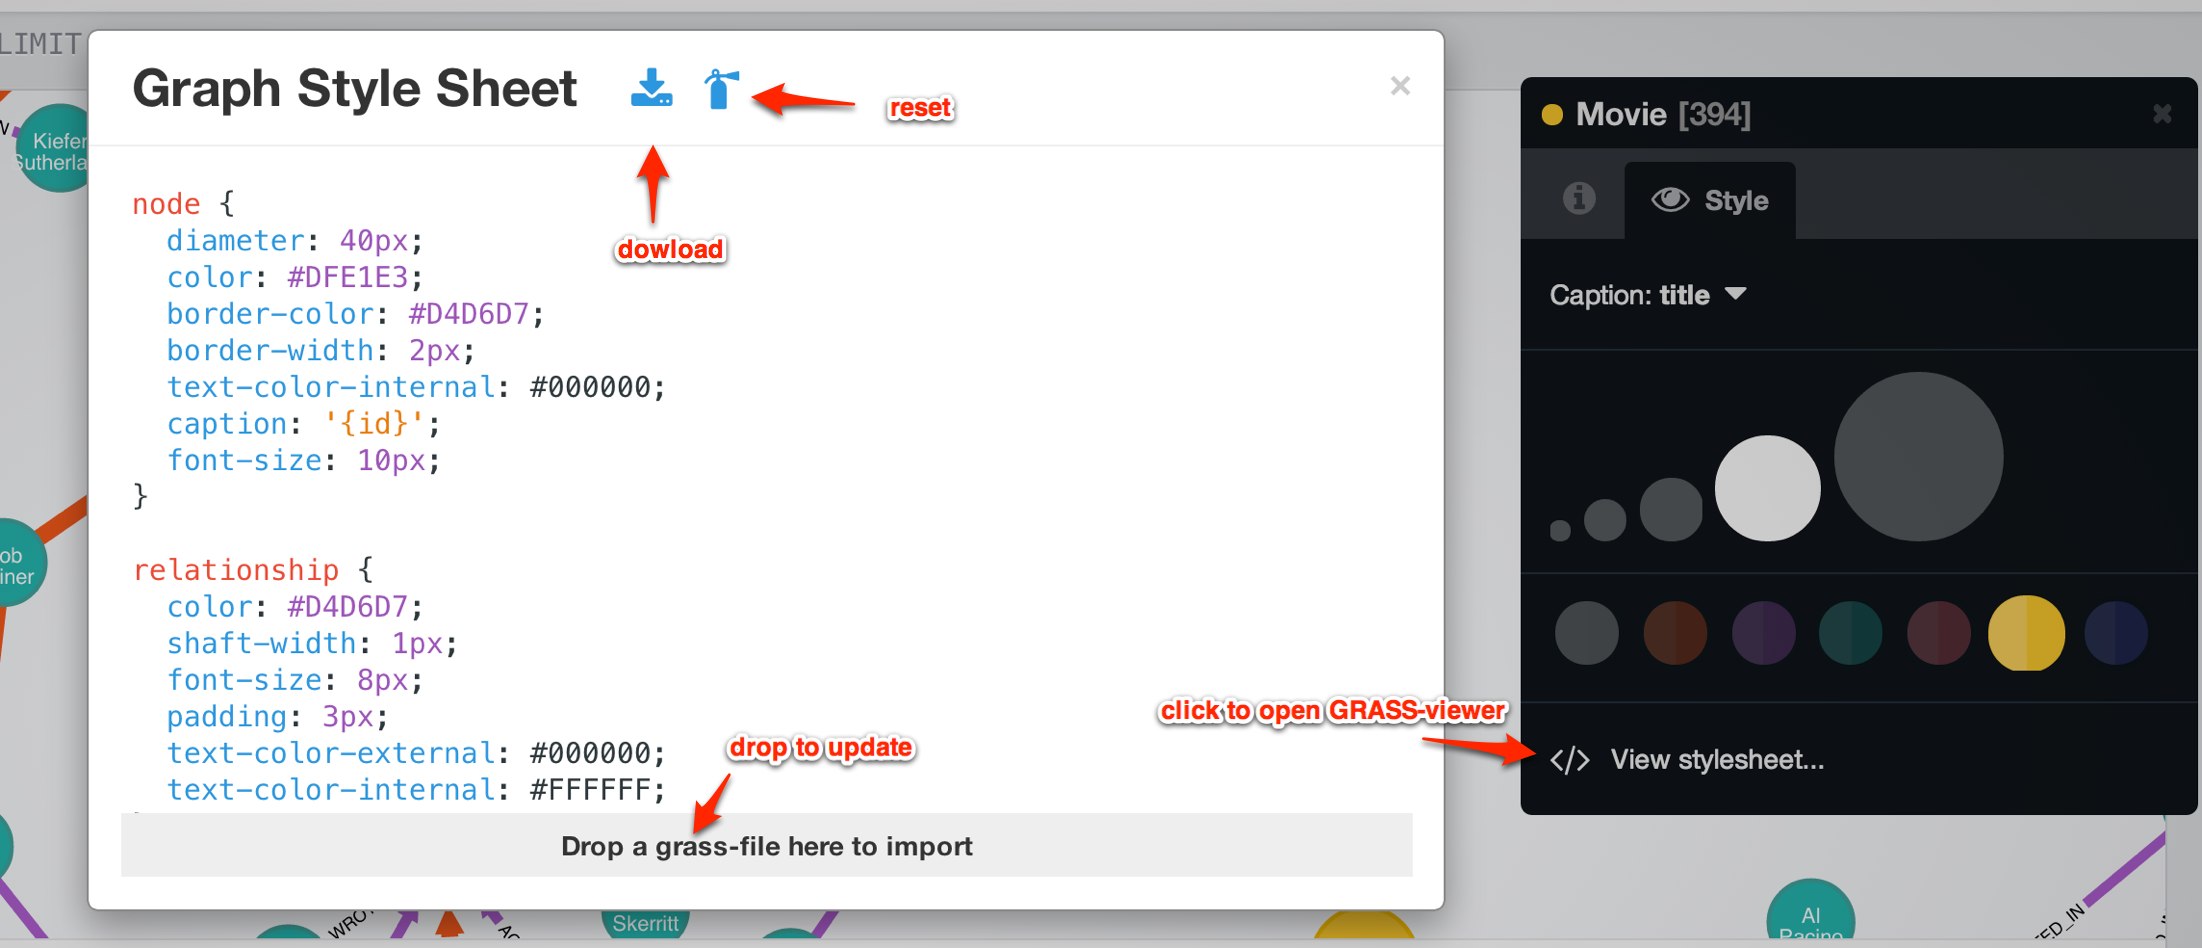
The whole visualization is powered by a concept called Graph Style Sheet or GRASS. You can access the style sheet with the link at the bottom of the styling popup. The resulting style renderer allows you to look at the style-sheet, download it or update it via drag-and-drop. You can also reset all styling with the "fire extinguisher".
If you rather watch me performing all these things, here is the screencasts that explains it all in detail. Enjoy!